import numpy as np import matplotlib.pyplot as plt
1 2 3 4 5 6 7 8 9 10
# 计算给定(w,b)的平均误差 defcompute_error_for_line_given_points(b, w, points): totalError = 0 for i inrange(0, len(points)): x = points[i, 0] y = points[i, 1] # computer mean-squared-error totalError += (y - (w * x + b)) ** 2 # average loss for each point return totalError / float(len(points))
1 2 3 4 5 6 7 8 9 10 11 12 13 14 15 16 17 18 19
defstep_gradient(b_current, w_current, points, learningRate): b_gradient = 0 w_gradient = 0 N = float(len(points)) for i inrange(0, len(points)): x = points[i, 0] y = points[i, 1] # 求导数 除N取平均值 # grad_b = 2(wx+b-y) b_gradient += (2/N) * ((w_current * x + b_current) - y) # grad_w = 2(wx+b-y)*x w_gradient += (2/N) * x * ((w_current * x + b_current) - y) # update b' w' # 梯度指向极大值方向 因此反方向更新梯度 new_b = b_current - (learningRate * b_gradient) new_w = w_current - (learningRate * w_gradient) temploss = compute_error_for_line_given_points(new_b, new_w, points) loss.append(temploss) return [new_b, new_w]
1
2
3
4
5
6
7
8
defgradient_descent_runner(points, starting_b, starting_w, learning_rate, num_iterations): b = starting_b w = starting_w # update for several times for i inrange(num_iterations): b, w = step_gradient(b, w, np.array(points), learning_rate) return [b, w]
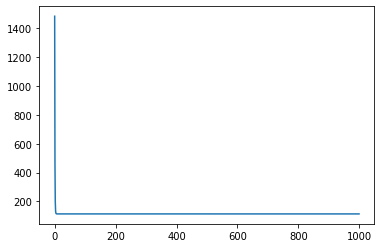
Starting gradient descent at b = 0, w = 0, error = 5565.107834483211
Running...
After 1000 iterations b = 0.08893651993741346, w = 1.4777440851894448, error = 112.61481011613473
1
2
x = [i for i inrange(0, len(loss))] plt.plot(x,loss)