1
2
3
4
5
6
7
8
9
10
11
12
13
14
15
16
17
18
19
20
21
22
23
24
25
26
27
28
29
30
31
32
33
34
35
36
37
38
39
40
41
42
43
44
|
X_train = [[6], [8], [10], [14], [18]]
y_train = [[7], [9], [13], [17.5], [18]]
X_test = [[7], [9], [11], [15]]
y_test = [[8], [12], [15], [18]]
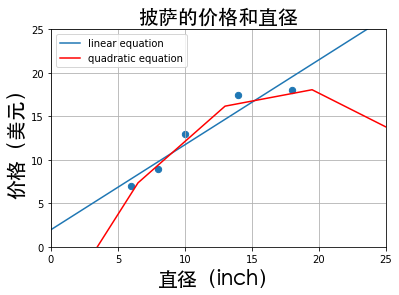
plt1 = runplt()
plt1.scatter(X_train, y_train,s=40)
xx = np.linspace(0, 26, 5)
regressor = LinearRegression()
regressor.fit(X_train, y_train)
yy = regressor.predict(xx.reshape(xx.shape[0], 1))
plt.plot(xx, yy, label="linear equation")
quadratic_featurizer = PolynomialFeatures(degree=2)
X_train_quadratic = quadratic_featurizer.fit_transform(X_train)
regressor_quadratic = LinearRegression()
regressor_quadratic.fit(X_train_quadratic, y_train)
xx = np.linspace(0, 26, 5)
print (xx.shape)
print (xx.shape[0])
xx_quadratic = quadratic_featurizer.transform(xx.reshape(xx.shape[0], 1))
print (xx.reshape(xx.shape[0], 1).shape)
plt.plot(xx, regressor_quadratic.predict(xx_quadratic), 'r-',label="quadratic equation")
plt.legend(loc='upper left')
plt.show()
X_test_quadratic = quadratic_featurizer.transform(X_test)
print('linear equation r-squared', regressor.score(X_test, y_test))
print('quadratic equation r-squared', regressor_quadratic.score(X_test_quadratic, y_test))
|
